Showing posts with label Federal Reserve. Show all posts

Tuesday, January 29, 2013

QE Effect on S&P 500

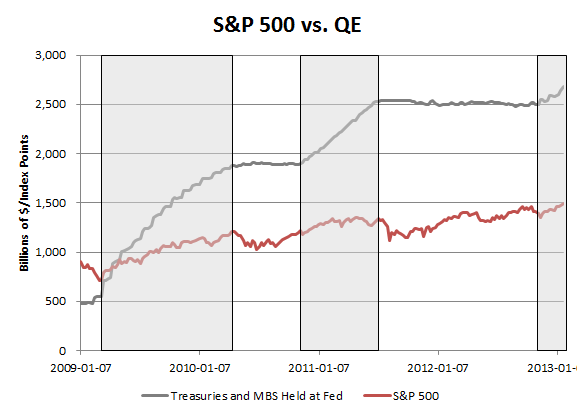
After QE3's announcement in mid September there was some concern that the effect of QE on the market had eroded because the S&P 500 proceeded to sell off by 5%.  It could be true that QE is losing its efficacy, but it's worth noting that true balance sheet expansion didn't really start until mid November because of the mechanics of MBS purchases.  It therefore may or may not be coincidental that MBS started to show up on the Fed's balance sheet around the same time that the S&P 500 found a bottom.

Below is a chart of how the S&P 500 has done during periods of QE, but instead of using the announcement dates, the chart highlights the times that the Fed's holdings of Treasuries and MBS were increasing (note that this analysis therefore excludes operation twist).  Since the S&P 500 is now hitting new cycle highs, perhaps one could argue that QE hasn't exactly lost its potency.


Friday, December 14, 2012

How Long Can Real Interest Rates Remain Negative?

Ray Dalio made some news this week when he acknowledged that interest rates had probably gone about as low as they could possibly go and that the next big opportunity will be shorting the bond market.  I'm inclined to agree, but there is some historical precedent for rates to go lower and stay there for even longer.

Dalio argued that real rates are currently negative (nominal rate minus inflation)--which they are--but they were also negative for 10 years between 1936 and 1946 as shown by the chart below, which compares Moody's average Aaa bond yield to the realized 10 year forward inflation rate.  Inflation was high during this period, reaching above 10% in some years thanks to WWII.  The fact that rates stayed low is a testament to the fact that it's not a good decision to try to fight the Fed.

Real Interest Rates Negative World War II
Used Aaa bonds as proxy for risk free rate.  Source: Federal Reserve Data

Thursday, December 13, 2012

Annual Change in Monetary Base Since 1918

After yesterday's post forecasting that we could see a 40% y/y increase in the monetary base in 2013, I thought it might be good to look at a long term chart of the monetary base to put that number into context.  Below is a chart showing the rolling y/y increase in the monetary base since 1918.  The only other time there has been such a steep increase in the US base was during the depression/WWII era during which there were three different periods of 20% annual growth in the base.


Wednesday, December 12, 2012

When Will Unemployment Hit 6.5%?

As part of today's statement, the Fed acknowledged that it would be maintaining the current QE rate until unemployment hits 6.5% or inflation gets out of hand (paraphrase).  Below is an estimate of when unemployment could hit that level based on an extrapolation of the current pace of decline.  Since peaking in late 2009 at 10%, the unemployment rate has fallen on average at about 6 basis points per month (.06%).  If it continues at this pace, the unemployment rate would hit 6.5% in mid 2014.

[Note that the decline has not materially picked up much pace in 2012.  In 2012 the rate declined by an average of 7bps per month.  At this pace 6.5% would occur just a few months earlier in 2014.]

Unemployment Forecast

Friday, November 30, 2012

Bank Reserves at Federal Reserve

Over the last several years, many analysts have argued that QE isn't inflationary because the money that the Fed has printed has been locked up in reserve balances.  I don't personally share this view, but it's worth noting that recently reserve balances have been contracting and currency in circulation has been growing as banks have chosen to convert reserves to currency.  Currency in circulation is now growing at nearly a 10% annual rate.


QE3 Just Starting to Hit Fed Balance Sheet

Although QE3 was announced almost 2.5 months ago, the mortgages that the Fed has been purchasing have only just started to hit the Fed's balance sheet over the last couple of weeks.  The monetary base has continued to hold flat, but mortgage holdings have ticked ever so slightly higher.

The Fed has agreed to purchase ~$100B worth of mortgages since September, but holdings have only increased by $40B due to the lag in time of settlement for MBS trades.  The fact that the balance sheet has mostly been unchanged suggests that we may not yet have seen the effects of QE3 in securities markets.


Tuesday, October 23, 2012

Length of Fed Chair Terms

There are reports this morning that Ben Bernanke wont stand for re-appointment as chairman of the Fed even if Obama wins re-election.  Considering that only a month ago he pushed to extend QE indefinitely, leaving now seems equivalent to changing pilots mid flight. Still, Bernanke has been chair for 6 years.  How does this compare to the term length of other chairmen?

At a little under 19 years, William McChesney Martin held the post for the longest period, which Alan Greenspan nearly matched.  Eugene Black had the shortest term at 15 months.  The average term length is ~7 years.

How Long has Ben Bernanke Been Fed Chair?

Friday, October 19, 2012

Federal Reserve Districts by Population

This post wasn't spurred by anything in particular, but I thought it was interesting to think about the fact that the 12 Federal Reserve districts are far from evenly distributed in terms of geography, population and deposits.  For instance, the San Fransisco district contains 20% of the population and New York contains 65% of the system's deposits.  Originally some of the existence of the regional banks was necessitated by the needs of processing physical money and checks, but with electronic currency that function is less necessary today. 

In 2006,  Tom Hoenig wrote an interesting piece defending the 12 bank system which can be found here.  The structure of the Federal Reserve as 12 banks says a lot about American political values, especially in 1913.  We are a nation that has historically fought passionately over the idea of federalism vs. centralization of government power.  The choice between Hamilton and Jefferson is what forms the backbone of American political history.  1913 marks somewhat of a crossroads of a Jeffersonian age turning slightly more Hamiltonian.  Today Hamilton firmly has the upper hand, but perhaps eventually the pendulum will swing back the other way with major implications for the current political-economic paradigm.


Friday, September 21, 2012

Publicly Traded Federal Debt Continues to Rise

US Federal debt is broken down into two different categories: publicly traded and non-publicly traded.  The non publicly traded debt is typically intergovernmental debt--more specifically it is debt that is owed to Social Security.  Those who are less concerned about Uncle Sam's debt situation tend to write off the intergovernmental debt and exclude it from Debt to GDP calculations.  This is why you may have seen widely variant accounts of what the US Debt to GDP ratio is.

It's getting problematic to hide this debt though because the last few years of deficits have been mostly financed by floating new tradable debt.  The chart below shows publicly traded debt as a percent of total Federal debt.  Prior to 2008 the ratio was about 50/50.  Today Federal debt is nearly 70% publicly traded.  This is concerning because it's obviously more difficult to control publicly traded debt.

The other issue is that as the Fed extends its maturities more and more, the maturity profile of the truly publicly floated debt becomes shorter and shorter.  Short term funding is what causes banks to be susceptible to bank runs and was the primary point of failure for Bear and Lehman.

Public Federal Debt as Percent of Total

Wednesday, September 19, 2012

Comparison of Japan and US Monetary Base

Before the Fed eased last week, I wrote that the ECB's actions could force the Fed to ease in order to maintain the value of the dollar relative to the euro.  Today, the BOJ's decision to purchase another 10T Yen worth of assets confirms that global central banks are in a prisoner's dilemma race to the currency bottom.

Below is a chart of the relative size of the Japanese monetary base compared to the US base.  The Japanese monetary base is about 50x larger than the US base (measured in nominal local currency units), but for most of the last 2 decades it has been more like 100x the size.  The chart implies that as the US monetary base grows compared to the Japanese, the Yen could strengthen further, which is a problem for a Japanese economy that relies on exports.  Unfortunately for Japanese exporters, the Fed has announced an easing program which is likely to be larger than the BOJ's.

BOJ balance sheet vs. Fed

Thursday, September 13, 2012

The Fed Can't Extend Twist Because it's Running Out of Short Term Bonds to Sell

Along with announcing more QE today, the Fed reiterated that Operation Twist will continue through the end of the year.  Interestingly, the Fed might not be able to extend twist beyond year end even if it wanted to.  That's because the Fed has almost completely exhausted its portfolio of short term treasuries, and at the current pace it probably wont have many short term Treasuries on its balance sheet at year end.

Below is a chart of the maturity profile of Treasuries on the Fed's balance sheet.  In total, the Fed owns $1.6T worth of Treasuries, and only $490B of that is paper with less than 5 years of maturity.  Only $3B of that has a maturity of less than 1 year.

At the current pace of $45B per month, the Fed will sell 30% of its remaining 1-5 year holdings by year end and be left with about $350B of 3-5 year maturities (assuming the 1-5 year portfolio is roughly equally weighted by maturity and they sell the nearest maturities first).  From there, it would be about 8 months until the Fed has sold all maturities 5 years and in.

The end of operation twist could have a couple of major implications for rates markets in 2013.

1) Twist is empirically the only monetary program so far that has actually flattened the curve while pushing equity prices higher.

2) Since the new QE is only focused on mortgages, the Treasury market could be missing a major buyer in 2013.

Could this, along with the very real inflation implications of printing money in an economy with tightening capacity utilization finally be the straw that breaks the rates market's back?



Forecast of Monetary Base to 2015 Based on Today's Fed Action

Pretty much as expected, the Fed announced that it will be conducting outright QE at the pace of $40B per month without any clear end date.  Based on this pace of purchases, below is a forecast of what the monetary base could look like out to 2015 assuming that the Fed prints at today's pace for as long as it intends to keep rates exceptionally low.

If this pace were maintained until then, the monetary base would increase by about 5x between 2008-2016, which would be a CAGR of 22%.  The current pace of $40B per month represents an annualized growth of about 18% from current levels.  Given gold and oil's correlation with the growth of the monetary base, $2700 gold and $170 brent crude prices might not be out of the question if the Fed maintains QE for that long.


Tuesday, September 11, 2012

Will there be more QE?

Given that Mario Draghi announced unlimited asset purchases last week, equity markets have been rallying along side the Euro; however, if Draghi ends up exercising his buying power and Bernanke doesn't announce more QE tomorrow, the Euro rally may be short lived.  Since 2009 (as theory would predict) the value of EUR/USD has been closely linked with the relative size of each central bank's balance sheet.  The more that the Fed prints, the more the EUR gains against the dollar.  The more the ECB prints, the more the EUR falls against the dollar.

Euro value ECB Fed Balance SheetRecently following two sizeable LTROs the ECB balance sheet has grown significantly to eclipse the Fed balance sheet (in nominal fiat/local currency terms).  The balance sheet would likely expand even further on new outright purchases.  This implies that there could be further downside for the Euro, unless Bernanke acts to counteract.

The ECB's newfound willingness to expand its balance sheet introduces an interesting game theory aspect to US monetary policy that wasn't as prominent in 2009/10.  If Bernanke wants a weak dollar relative to other global currencies, he may be forced to act further.  Otherwise we could be looking at a much stronger dollar along with the anti-correlated equity prices that come with that.

Of course, who cares if the numerical value of the S&P falls if the dollars that measure its value are worth more?  Depending on his actions, Bernanke might.


Monday, August 13, 2012

Alan Greenspan on Forecasting in Businessweek

This week's issue of Businessweek has an interview with Alan Greenspan, in which there was an interesting exchange on his ability to forecast future events.
You also told the commission that you were right 70 percent of the time and wrong 30 percent of the time. What were you wrong on?   
Forecasting the next week’s stock market change. I’ve been in the forecasting business for more than half a century. If I get it right 70 percent of the time, I consider that very successful. People don’t realize that we cannot forecast the future. What we can do is have probabilities of what causes what, but that’s as far as we go. And I’ve had a very successful career as a forecaster, starting in 1948 forward. The number of mistakes I have made are just awesome. There is no number large enough to account for that. But I’m right more than half the time.  
Some people said you were giving yourself a C-minus, but maybe in the business of predictions, a C-minus is better than it sounds? 
Forecasting our futures is built into our psyches because we will soon have to manage that future. We have no choice. No matter how often we fail, we can never stop trying. The ancient Greeks had the Oracle of Delphi, who allegedly had the capability of seeing into the future, and military leaders used to go to her. And then there’s Nostradamus, two millennia later, who had very much the same aura. Fortunetellers and stockpickers today make a reasonably good living. Physical scientists can forecast with some precession. But in economics, we are extraordinarily fortunate that we succeed a majority of the time. (I think there's room for debate on this one)

Wednesday, August 1, 2012

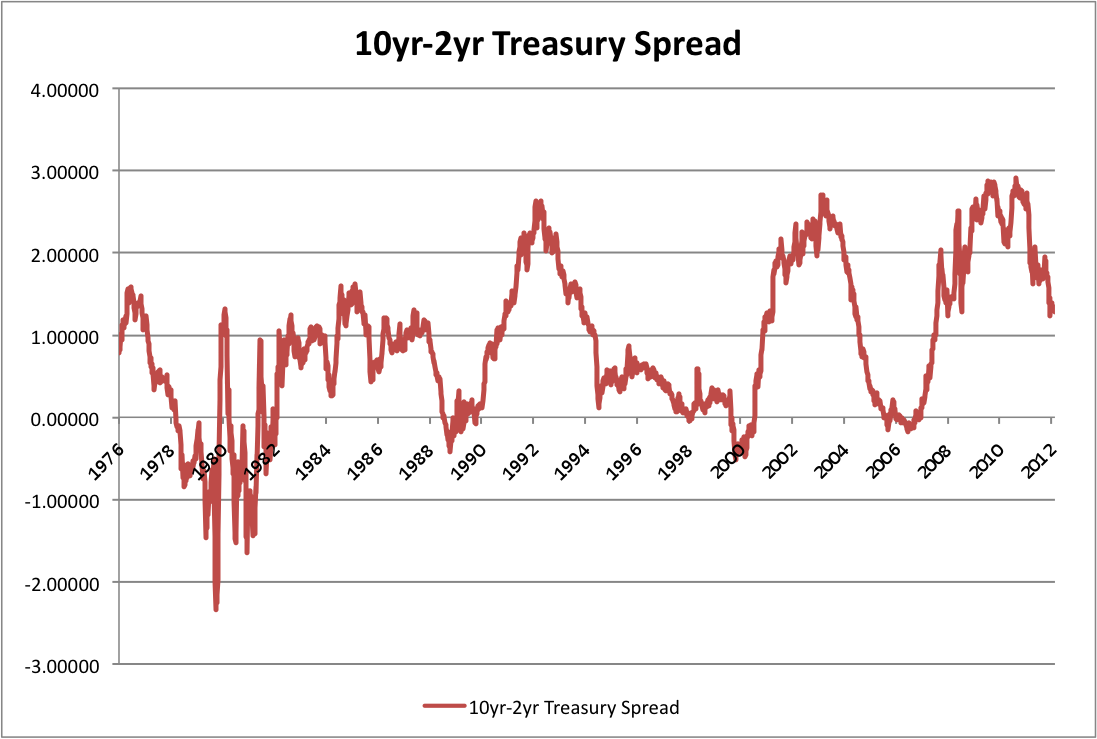
2s 10s spread

The Fed is set to speak again today and chatter of new stimulus has been picking up in recent weeks.  While it's been over a year since our last round of pure QE ended, we have been living in an operation twist world since last September, and can expect to continue to live in one through the end of the year at least.

While the effectiveness of twist on the economy is debatable, it's clear that the program has had a real effect on the steepness of the yield curve.  After reaching an all time steep level mid last year, the spread of the 10 yr vs. the 2 yr has been collapsing since.  In a typical economic cycle, recession would be about a year out now, and typically that would be accompanied by an inverted yield curve.  

Currently we are about one year into a flattening curve and if the pace continues we could be inverted by this time next year.  The question is, if 2 yrs are anchored at 0.25%, does that mean that the 10 yr could get that low?


Thursday, July 26, 2012

Monetary Base Grew Last Week

One indicator that we pay close attention to is the monetary base, the sum of currency and reserve balances at the Fed.  Over the last two weeks the base has grown by $43B, about 1.5%.  The base is important to us because of the relationship that it has had with commodity prices over the last several years.  If the relationship holds, it might suggest that commodity prices like oil and gold will trend sideways rather than down.


As far as Fed Balance sheet trends go, it's also worth noting that reserve balances continue to fall.  The "reserve balances" line is a perennially misunderstood line-item, which is often used as evidence that excess liquidity is just being stored at the Fed rather than entering the economy.  In actually the high level of excess reserves is just a symptom of QE because in the aggregate all of the reserves in the system must return to the Fed even if different banks hold them.  At any rate, these reserves are now starting to be converted more rapidly into hard currency, which should render the argument over excess reserves moot.


Fed Liabilities Portion of Balance Sheet: