Showing posts with label Operation Twist. Show all posts

Friday, September 21, 2012

Publicly Traded Federal Debt Continues to Rise

US Federal debt is broken down into two different categories: publicly traded and non-publicly traded.  The non publicly traded debt is typically intergovernmental debt--more specifically it is debt that is owed to Social Security.  Those who are less concerned about Uncle Sam's debt situation tend to write off the intergovernmental debt and exclude it from Debt to GDP calculations.  This is why you may have seen widely variant accounts of what the US Debt to GDP ratio is.

It's getting problematic to hide this debt though because the last few years of deficits have been mostly financed by floating new tradable debt.  The chart below shows publicly traded debt as a percent of total Federal debt.  Prior to 2008 the ratio was about 50/50.  Today Federal debt is nearly 70% publicly traded.  This is concerning because it's obviously more difficult to control publicly traded debt.

The other issue is that as the Fed extends its maturities more and more, the maturity profile of the truly publicly floated debt becomes shorter and shorter.  Short term funding is what causes banks to be susceptible to bank runs and was the primary point of failure for Bear and Lehman.

Public Federal Debt as Percent of Total

Thursday, September 13, 2012

The Fed Can't Extend Twist Because it's Running Out of Short Term Bonds to Sell

Along with announcing more QE today, the Fed reiterated that Operation Twist will continue through the end of the year.  Interestingly, the Fed might not be able to extend twist beyond year end even if it wanted to.  That's because the Fed has almost completely exhausted its portfolio of short term treasuries, and at the current pace it probably wont have many short term Treasuries on its balance sheet at year end.

Below is a chart of the maturity profile of Treasuries on the Fed's balance sheet.  In total, the Fed owns $1.6T worth of Treasuries, and only $490B of that is paper with less than 5 years of maturity.  Only $3B of that has a maturity of less than 1 year.

At the current pace of $45B per month, the Fed will sell 30% of its remaining 1-5 year holdings by year end and be left with about $350B of 3-5 year maturities (assuming the 1-5 year portfolio is roughly equally weighted by maturity and they sell the nearest maturities first).  From there, it would be about 8 months until the Fed has sold all maturities 5 years and in.

The end of operation twist could have a couple of major implications for rates markets in 2013.

1) Twist is empirically the only monetary program so far that has actually flattened the curve while pushing equity prices higher.

2) Since the new QE is only focused on mortgages, the Treasury market could be missing a major buyer in 2013.

Could this, along with the very real inflation implications of printing money in an economy with tightening capacity utilization finally be the straw that breaks the rates market's back?


Correlation of Rates and S&P 500

Operation twist has had the opposite effect on rates that outright QE has had, but equities have rallied during twist just like they did during QE1/2.  This has lead to a divergence between equities and interest rates over the past year.  Previously equities and rates had been relatively correlated: when equities moved higher so did interest rates.  Recently though, the daily correlation has broken down and over the past year has actually turned slightly negative.

Rates S&P 1 year correlation

Wednesday, August 1, 2012

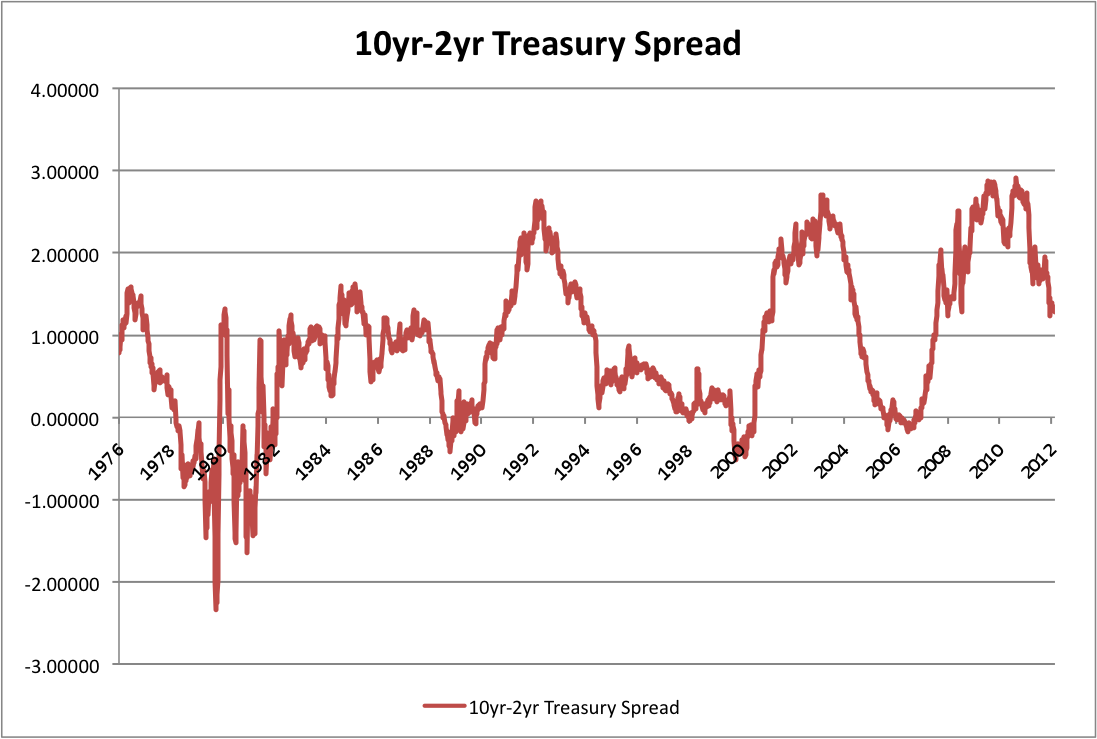
2s 10s spread

The Fed is set to speak again today and chatter of new stimulus has been picking up in recent weeks.  While it's been over a year since our last round of pure QE ended, we have been living in an operation twist world since last September, and can expect to continue to live in one through the end of the year at least.

While the effectiveness of twist on the economy is debatable, it's clear that the program has had a real effect on the steepness of the yield curve.  After reaching an all time steep level mid last year, the spread of the 10 yr vs. the 2 yr has been collapsing since.  In a typical economic cycle, recession would be about a year out now, and typically that would be accompanied by an inverted yield curve.  

Currently we are about one year into a flattening curve and if the pace continues we could be inverted by this time next year.  The question is, if 2 yrs are anchored at 0.25%, does that mean that the 10 yr could get that low?