Earlier today I posted a chart of the flattening US yield curve. I thought for reference it might be interesting to look at Japan's yield curve over the last few decades. The curve hasn't ever quite inverted, but has gotten to a 0.5% spread on a few occasions.
It's important to note that it's not clear what the maturity of the short term bond is from the data source that I pulled this from, so this isn't necessarily an apples to apples comparison to the US chart. It looks to me like the short term chart may be more equivalent to a fed funds rate than a 2 yr bond. It's an interesting chart in its own right and is posted below.
Japan has been in ZIRP for over a decade. There remains no empirical evidence that ZIRP is effective in stimulating economic growth.
Showing posts with label Yield Curve. Show all posts
Wednesday, August 1, 2012
2s 10s spread
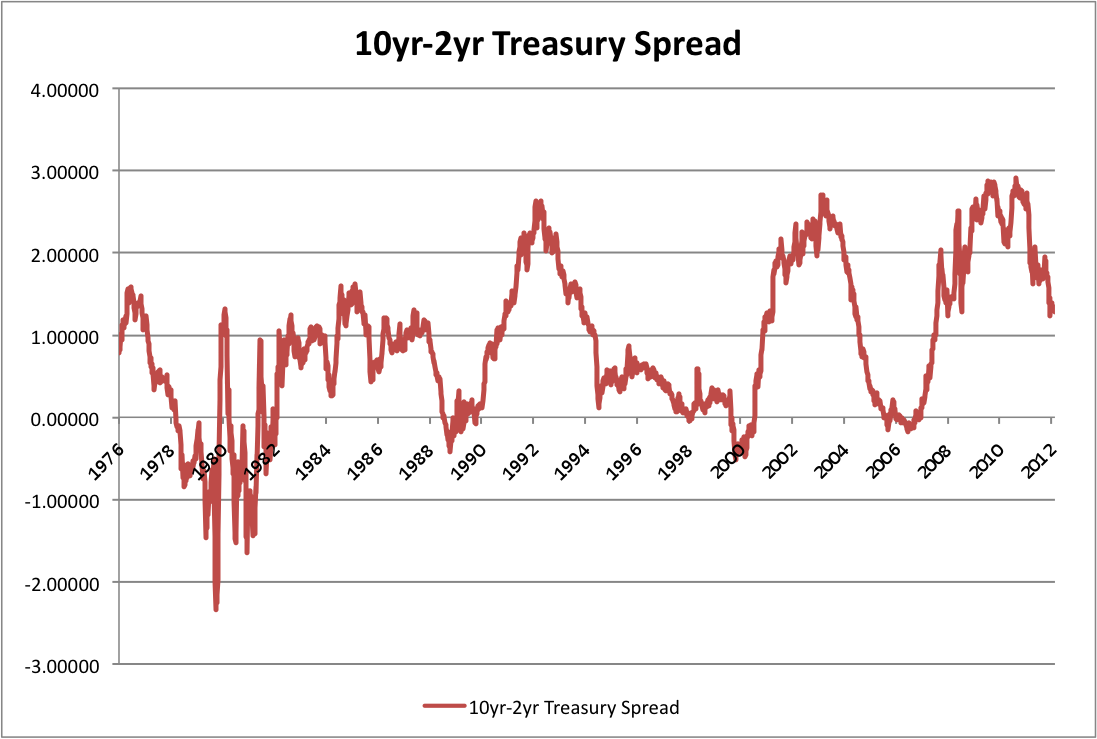
The Fed is set to speak again today and chatter of new stimulus has been picking up in recent weeks. While it's been over a year since our last round of pure QE ended, we have been living in an operation twist world since last September, and can expect to continue to live in one through the end of the year at least.
While the effectiveness of twist on the economy is debatable, it's clear that the program has had a real effect on the steepness of the yield curve. After reaching an all time steep level mid last year, the spread of the 10 yr vs. the 2 yr has been collapsing since. In a typical economic cycle, recession would be about a year out now, and typically that would be accompanied by an inverted yield curve.
Subscribe to:
Posts (Atom)