

Tuesday, July 31, 2012
July Economic Data Summary
Over the course of any month there is a heap of economic data that is released by various governmental and quasi-governmental organizations. The data can come so quickly that it's often difficult to keep track of what has shown strength or weakness and which indicators are beating or missing Wall Street estimates. To try and help summarize what was released in July, below is a list of 32 of the more important economic releases last month. Of these 32 releases, 14 (~44%) missed expectations.

Baltic Dry Index Historical Data
Back in late 2007 and early 2008 when commodity markets were really humming, the Baltic Dry Index was a closely followed indicator of economic activity (especially in emerging markets). It measures the daily cost of chartering a dry bulk ship to move commodities across the ocean. In late 2008 it collapsed in the financial crisis and has never recovered as a glut of newly built dry bulk ships flooded the market. It's interesting to see the the index is back to its lowest levels.


Monday, July 30, 2012
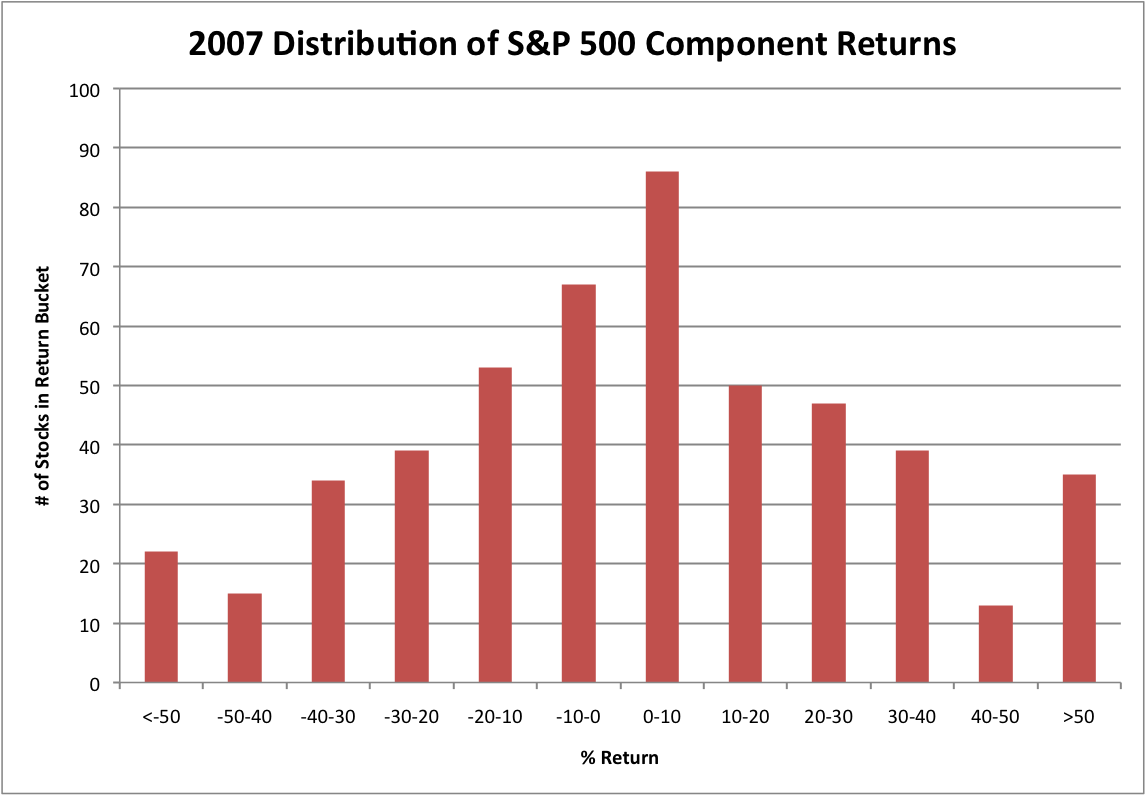
Is this a Stock Picker's Market?
Ever since 2007, when the market started to do whacky things, many investment managers have been looking for a "stock picker's market" in which correlations recede and alpha can be generated by picking a better group of stocks than the next guy rather than being at the whims of beta.
In order to gauge whether 2012 is finally a stock picker's market, below are some histograms of the performance of S&P 500 components grouped by buckets of return. Perhaps one might expect that a stock picker's market would show a relatively even distribution among the buckets rather than a concentration in any single bucket. To the extent that hypothesis is correct, 2011 looks slightly more like a stock picker's market than 2012.


In order to gauge whether 2012 is finally a stock picker's market, below are some histograms of the performance of S&P 500 components grouped by buckets of return. Perhaps one might expect that a stock picker's market would show a relatively even distribution among the buckets rather than a concentration in any single bucket. To the extent that hypothesis is correct, 2011 looks slightly more like a stock picker's market than 2012.


Friday, July 27, 2012
Nikkei Priced in Dollars
Yesterday's post about the S&P 500 priced in Euros got me thinking about other markets that might be interesting to view priced in foreign currencies. Below is a chart of the Nikkei priced in dollars. Because the Yen has generally appreciated against the dollar over the course of Japan's (somewhat mythical) lost decades, the Nikkei's fall is a little softer when viewed in dollar terms.


S&P 500 Trading Volume Recent History
Even as the Dow looks like it could post back to back 200 point increases, there are signs that equity markets are still structurally quite ill. Aggregate volume in S&P 500 component stocks continues to decline. While summer is always a light volume period seasonally, each of the last three summers have seen lower lows. Price doesn't necessarily need volume for confirmation, but it is worrisome that there are fewer and fewer participants in the equity markets.


Thursday, July 26, 2012
S&P 500 Priced in Euros
Today the S&P 500 was up 1.65%, but considering that the dollar was down 1.26% vs. the Euro, if you were a European investor in the US market, you hardly realized any gains--such is the power of currency. Much like how perception of physical motion is defined by one's frame of reference, motion in financial markets only meaningful relative to the value of the currency of reference. Gains and losses in markets, measured in currency, can be completely illusory based on the change in value of the currency itself. To illustrate the point, the chart below is a chart of the S&P 500 as viewed by a European investor, measured in Euros. It's a completely different picture than the one that we're used to seeing, primarily because 2007 never reached the peak of 2000. Bull and Bear markets happen over different time frames. Technical levels become completely different. Simply rebasing the unit of measurement can alter the interpretation completely. YTD the S&P 500 is up 15% in Euro terms compared to 8% in USD.


Monetary Base Grew Last Week
One indicator that we pay close attention to is the monetary base, the sum of currency and reserve balances at the Fed. Over the last two weeks the base has grown by $43B, about 1.5%. The base is important to us because of the relationship that it has had with commodity prices over the last several years. If the relationship holds, it might suggest that commodity prices like oil and gold will trend sideways rather than down.

As far as Fed Balance sheet trends go, it's also worth noting that reserve balances continue to fall. The "reserve balances" line is a perennially misunderstood line-item, which is often used as evidence that excess liquidity is just being stored at the Fed rather than entering the economy. In actually the high level of excess reserves is just a symptom of QE because in the aggregate all of the reserves in the system must return to the Fed even if different banks hold them. At any rate, these reserves are now starting to be converted more rapidly into hard currency, which should render the argument over excess reserves moot.

Fed Liabilities Portion of Balance Sheet:


As far as Fed Balance sheet trends go, it's also worth noting that reserve balances continue to fall. The "reserve balances" line is a perennially misunderstood line-item, which is often used as evidence that excess liquidity is just being stored at the Fed rather than entering the economy. In actually the high level of excess reserves is just a symptom of QE because in the aggregate all of the reserves in the system must return to the Fed even if different banks hold them. At any rate, these reserves are now starting to be converted more rapidly into hard currency, which should render the argument over excess reserves moot.


Wednesday, July 25, 2012
Tupperware Commentary 2Q12
An interesting take on the world economy from Rick Goings, CEO of Tupperware, an extremely global company:
I spent a lot of time this last month doing not only big group but one on one meetings with the investment community, not only in the United States but more and more focusing on Europe where people tend to hold longer. And but one of the key questions I’m asked almost everywhere I’m, is people want to tap into what are we seeing out there and what do we hear out there?
They understand that the bulk of our sales and profits are outside the U.S., which by the way is only 5% of the world’s population and this is an important question because the perspective one has, if they are getting their news from Wall Street Journal, Financial Times, CNBC or even many U.S.-based analyst reports, one would think that the world is in chaos and it’s bleak out there.
And yet, we just did a review and quite frankly, our perspective is there’s more firm places, more (inaudible) firm out there in the world and things look pretty good and look better than we’ve seen in years. Here’s a brief scan.
In Europe, contrary to what you may read, Europe is not going to fall into the Mediterranean, although it sells newspapers. Politicians there are showing a never before level of commitment and flexibility as they work to hold euro land together. And they are driven by two major things, the desire for peace and economic necessity.
But I do the review and I say well, CIS under Putin, Medvedev, Russian style but it works and we feel good. Nordics look good, Germany looks good. We get down into Turkey, looks good. Greece, who cares, it’s too small, Italy, 66 governments since the Second World War, its stability Italian style.
And then we turn it up, Benelux looks good and it is interesting in France, even under Holland, an interesting perspective. Most of the dramatic changes in governments with regard to repositioning government spending to be less happened under mid land who was an extreme left wing. So we, because he had the ability to bring the assembly within, so I feel, okay, about Europe.
Turning to Latin America, a few topline points in major markets, I already mentioned about the PRI in Mexico. So I feel good about that. In Venezuela, it appears Chavez’s grip is slipping, plus he’s sick, Brazil, fifth largest population in the world, sixth largest economy in the world and a real bright future.
In Asia, finally, 40% of the population, China, India, Indonesia and the driving force is going to be the explosive growth of their middle class, which is going to move from $500 million to $1.7 billion by 2020. In each of these markets, importantly, we have been awarded the status Superbrand. This is interesting, because we’ve never advertised.
Now, I know when somebody reads the recent talk of China’s economy slowing, two things are important to remember. Number one, it’s still growing at 7.5% and number two, the government which is very directive has been proactive with the stimulus and matter of fact, they cut the borrowing rates to stimulate the economy twice in one month.
So, net-net, before I turn it over to Mike, a final thought. When you put it all together, we’re confident in our portfolio and our future. We’re not going to hit on all cylinders in every quarter.
ACE Insurance Commentary 2Q12
ACE Runs a crop insurance book. Evan Greenberg, the CEO had this to say about the drought conditions:
Evan Greenberg
You’re correct, this is the, these are the worst drought conditions that we have seen in the, that has been experienced in the forming community since 1988. It is broad-based though it is very much concentrated in the mid-west states and in 1988 crop insurance was much less factor in the overall financial pluming of the agriculture industry. It's far more wide spread and taken up as a valuable protection and this is center piece for the support of the agriculture industry today than it was in 1988.
Did the Repeal of Glass Steagall Cause the Financial Crisis?
Sandy Weill, former CEO of Citigroup caused a stir today by commenting that Glass Steagall should be reinstated. Since he is the person who pioneered the integrated banking model, the comments are shocking. The comments are puzzling too because even if one thinks that separating commercial and investment banks would create more stability in the long term, it's not entirely clear that the financial crisis stemmed directly from the integration.
Empirically, not a single integrated bank failed in 2008/2009. Lehman and Bear were not commercial banks, and Indymac and WaMu weren't investment banks. AIG, Fannie and Freddie were not banks of any sort. In fact, Goldman and Morgan Stanley (along with some insurance companies) were saved by converting to bank holding companies so that they could access liquidity at the Federal Reserve.
The argument for a separation of commercial and investment banking activities perhaps stems from the belief that depositors ("main street") need to be protected from the volatility of securities markets. However in today's economy, only a tiny portion of household savings is held as deposits anyways, so the savings of main street are far from insulated from a collapse of an investment bank (even if it were separated from the commercial banking system).
Below is a list of bank failures in 2008. Note that Lehman, Bear, AIG, Fannie and Freddie are not on the list. In all, 447 banks have failed between 2008-2012. The vast majority were community banks that were in "less risky" lending businesses. The fact is that banking is risky business in any form.
2008 Bank Failures

Tuesday, July 24, 2012
How Many Times Has the Dow Been Down 100 Points Three Days In a Row?
After today's fall, the Dow has been down more than 100 points the last three consecutive trading days. Below is a chart of the Dow showing the other times that this has happened.


Monday, July 23, 2012
Texas Instruments Earnings Call 2Q12 Commentary
"In terms of July, the rate of new orders in July really, Sumit, is consistent with what we saw in the month of June. So we haven't really seen a pickup, but we also haven't seen a further slowdown."
Eaton Conference Call 2Q12
"Global growth has clearly slowed. And the European and Chinese recovery, we think, get pushed out of 2012."
How many times has the Dow Jones Returned Greater than 20% in a year?
The analysis behind this post began as research to look at the distribution of stock market returns on a daily, monthly and annual basis to see to what extent the distribution can be labeled a "normal distribution." The data that I analyzed, going back to 1900 on the Dow Jones shows that on a daily and monthly basis, the data-set follows some sort of bell curve, but on an annual basis return buckets are all over the map.
Annual Data:
Sample size: 111
Average: 5.73% (not compounded and not including dividends)
Standard Deviation: 24.85%
Based on the way that I've bucketed annual returns, they don't appear to be clustered in any sort of bell curve. Returns were negative 38% of the time and greater than 20% almost 1/4 of the time.

Daily Data:
Sample Size: ~28,000
Average: 0.025%
Standard Deviation: 1.143%
Empirically, the Dow fluctuated between a 2% loss and 2% gain 94% of the time on a daily basis. The daily return of the Dow was between -0.7% and +0.7% 64% of the time.

Monthly Data:
Sample size: ~1300
Average: 0.5%
Standard Deviation: 5.33%
Empirically, 77% of monthly returns are between 5% and -5%. 91% occur between -8% and 8%.

Friday, July 20, 2012
Schlumberger 2Q12 Conference Call Highlights
Quote from SLB on its macro outlook:
Let's then turn around to the macroenvironment, where the continuing Eurozone crisis, coupled with the disappointing numbers from China and the U.S., has led to downward revisions of the outlook for GDP growth and oil demand. High production output from OPEC also lead to a period of crude inventory buildup during the quarter, which, together with fares or lower demand, brought Brent crude prices briefly below $90 before recovering.
At the same time, global spare capacity for oil is at the lowest level for 5 years and there continue to be a risk of potential production disruption from geopolitical events.
The situation in the global economy remains unsettled, and it seems increasingly clear that the present macro uncertainties will remain for a considerable period of time.
In this environment, we believe Brent crude prices, in general, will be supported around current levels, although they could be subject to periods of considerable volatility. Continued macro uncertainty coupled with price volatility could make customers more cautious in terms of future activity plans. However, in the international markets, we have seen no signs of this so far. We maintain, absent a future significant setback to the world economy, our safety view that international activity will grow in excess of 10% this year.
Trading Pattern 2012 vs. 2011
As we get into the final weeks of July, we find the market in an eerily similar spot to the one that it was in this time last year. So far 2012 has looked a lot like 2011. Hopefully we don't repeat last year's steep drop to begin August.


Thursday, July 19, 2012
How large would JCP be if it grew by 10-15x?
In an interesting moment yesterday, Bill Ackman said that he believes that he could realize a 10-15x return on his JC Penney investment. In order to get a sense of what this means, below is a table comparing the market caps of other US retailers to JCP. If JCP were to increase 10x from its current $4.3B market cap, that would make it the 4th largest retailer in the US. To increase by 15x would make it the 3rd. To be a 10 bagger, Ackman has to believe that JCP wont just beat the Kohls, Macy's, Sears and TJ Maxx's of the world, but also be bigger than Target and Costco too.


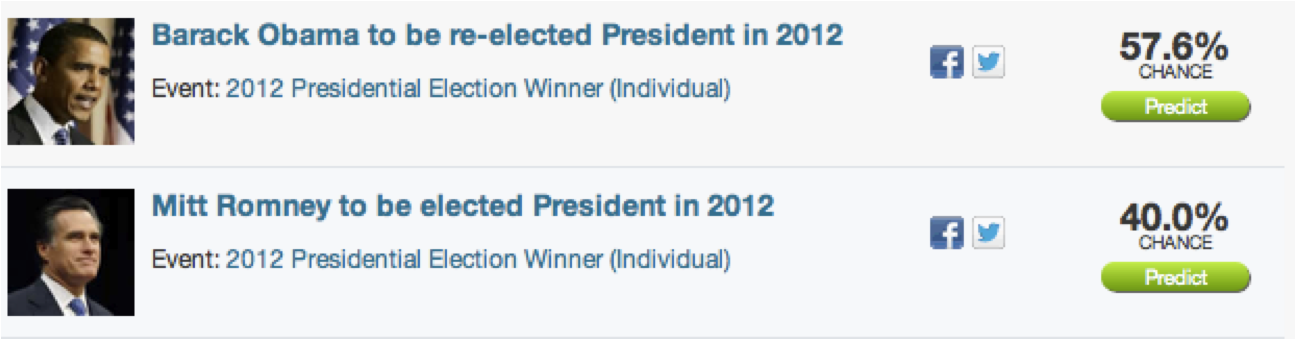
Clear Arbitrage Opportunity on Intrade
Even though intrade continues to gain in popularity as an indicator of the probability of a future event happening, it's interesting that the market seems to have some glaring inefficiencies. Not only is volume relatively light, but also, there is a clear arbitrage opportunity in the site's most popular contract.
Right now the Obama and Romney presidential contracts sum to show that there is only a 97.6% chance that Obama or Romney will be elected president this year. Seeing as how there is no viable 3rd party candidate in the race, the contracts seem to be discounting that there is a 2.4% probability that either Barack Obama or Mitt Romney will drop out of the race between now and November.
If an investor were to buy both contracts today, he or she could stand to earn a nearly risk free 2.4% between now and November: an annualized return of 8.1%.

Philly Fed Economic Activity Indicator
Philly Fed data was released this morning and was disappointing again with the diffusion index at -12.9, meaning that 12.9% more respondents reported contraction than expansion. There were also some special questions asked as part of the release that I thought were worth reposting here.


Wednesday, July 18, 2012
CSX 2Q12 Conference Call Highlights
"Automotive was a key driver in the industrial sector, growing 27% as North American light vehicle production increased 25% in the quarter. The chemicals market grew 1% with the frac sand and petroleum products being the primary drivers.
"In the construction sector, growth in building products was offset by a decline in aggregate shipments due to the completion of several stimulus projects.
"In the agricultural sector, volume declined across all major commodities. Corn shipments to the Southeast for animal feed were lower as a strong local wheat crop displaced Midwestern corn. Phosphate shipments declined as buyers delayed purchases in the expectation of moderating commodity prices. Finally, ethanol shipments softened as a result of lower gasoline demand. Looking forward, the Automotive market will continue to drive growth in the industrial sector. In addition, we continue to see growth opportunities in chemicals and Metals, particularly in commodities that support the oil and gas industry. In the construction sector, aggregate shipments will remain challenged, while recovering housing starts will drive continued growth in building products. Finally, we expect the agricultural sector to be stable with an increase of phosphate shipments being offset by a lower ethanol demand."Coal revenue declined 14% as strength in Export Coal partially offset significant weakness in utility coal volume. Domestic utility tons declined 37% as natural gas prices remain low, leading to the continued displacement of coal at some utilities. In addition, electrical generation declined in the Eastern United States. Partially offsetting this weakness, export coal volume grew 41% to 14.7 million tons in the quarter as demand was strong for U.S. thermal coal.
"Looking ahead, even though the market for export coal is volatile, we clearly expect to exceed the ton shipped in 2011 as the demand for U.S. coal will remain strong in the second half although not at the level we saw in the first half. At the same time, domestic utility volumes are expected to face continued challenges due to low natural gas prices, above normal inventory levels and environmental regulations. Headwinds should begin to moderate somewhat through the balance of this year.
"And if you look at the average age of the automobiles and the light trucks in the United States, they're some of the highest numbers that they've been post-World War II. The ability to secure financing and particularly longer-term financing in the range of 6 years has proved to be positive for the consumers as they go to purchase automobiles. Chrysler, for example, are adding third shift to their Belvidere plant. Hyundai Montgomery is adding third shifts to their plant. So I feel nothing but positive things about the automotive industry as we go forward."
PNC 2Q12 Conference Call Highlights
This is the preface to the CFO's segment on performance for the quarter.
In my remarks today, I will focus on the following: our loan growth and favorable shift in our deposit mix; our strong gains in net interest income; our growth in commercial and consumer fee income, excluding our mortgage repurchase provision; our disciplined expense, capital and liquidity management; and an update on our outlook for 2012 versus 2011.While seemingly innocuous this quote is indicative a huge shift in focus for the banking system in general. Two years ago, banks were focused on capital and credit. Today, the focus is back to growth.
How Does Housing Compare to the Tech Cycle?
Even though Bank of America is trading lower, today's quarterly release capped off what was a surprisingly good quarter for major US Banks. In general, loans and deposits both showed growth, capital levels are extremely high and credit quality is significantly improved from where it was during the crisis. Similarly, the housing sector has had some healthy reports as well recently (see previous post).
Seeing as how housing and banking were at the epicenter of the previous crisis, what does the fact that the two sectors are recovering say about where we are in the current economic cycle? To try to help discern how this cycle compares to previous cycles, below is a chart comparing the performance of housing (ITB) and Financials (XLF) in this cycle to Technology (XLK) in the last one. The chart shows relative performance of ITB, XLF and XLK compared to the S&P 500. ITB and XLF are shown from 2006 and 2012 and XLK is shown between 2000 and 2007.
After the sharp collapse of technology stocks relative to the S&P from 2000-2002, XLK languished on a relative basis for the next four years before finally starting to outperform in 2006. Similarly, both XLF and ITB showed steep drops and have continued to be losers since. Now, years later, they may finally be starting to show signs of a turn. XLK continued to steadily outperform the S&P 500 through 2012. However, by the time XLK turned in 2006, the general economy only had one year left before it began to contract.

Housing Starts Showing Signs of Life
Housing starts were reported this morning for June at the highest level since October 2008. The housing sector may still be operating at a low level, but it looks for now like it has at least broken out of the range that it had languished in for several years.


Tuesday, July 17, 2012
How Long Will It Be Until XLF Makes a New All Time High?
XLV may be making new all time highs, but its cousin, XLF is far from the point where it could make new highs of its own. Thanks to the heavy dilution that the financial sector incurred during the financial crisis, the companies that make up the XLF were among the few large companies that sustained permanent losses of capital since 2008. XLF made an all time high of $38.15 in 2007, but today sells for just $14.76.

Given the extreme destruction of capital it will be a long time before the financial sector makes back its losses per share, but eventually it should get there. XLF had a book value of $15.07 as of the end of 2011. If the ETF trades in line with book value and grows book value per share by 8% per year, XLF will reach a new peak around 12 years from today, 2024.

XLV Making New All Time Highs
Even though the S&P 500 is still down >10% from where it was in 2007, the healthcare sector SPDR has been making new all time highs over the last few days. XLV is the 4th of 9 sector ETFs to reach above its 07/08 highs. Energy, Materials, Industrials, Financials (of course) and (surprisingly) Utilities are all still below their former peaks.


Is Facebook Dying?
After rallying from $25 back to $32, FB stock has taken a beating in the past two days and is now back at $28 per share. While the stock movement is troublesome for owners, a trend that may be even more troubling is that in spite of a p/e multiple of 85x, FB's underlying business may be shrinking, not growing. Below is a chart pulled from Alexa.com which shows that the average amount of time that a user spends on Facebook is declining rather rapidly. Whereas in 2011 the average user spent over 30 minutes per day on facebook's site, over the last 7 days that figure has dropped below 20. Hopefully for Mark Zuckerberg, that extra time is being spent on Instagram.


How much is Lulu Worth?
Below is a comp table for a few specialty apparel retailers that I put together. Similar to CMG, it's pretty amazing to see the value that the market puts on Lululemon relative to the current size of its business. LULU has phenomenal operating metrics compared to its peers to be certain, but the price that a shareholder has to pay to own a part of the business is pretty exorbitant.
At a $7.5B enterprise value, LULU's 180 stores are valued at ~$42m per store and a whopping $14,875 per square foot. Obviously you're paying that price for growth not current operations, but think of the number of stores that need to be opened to bring the price per square foot more in line with the company's peers. That price is nearly 10x more than the closest comp on this table. LTD has 16x more stores than LULU but only 2.2x the market value.


CalPERS 2011/2012 Investment Performance
CalPERS, the country's largest pension fund reported investment performance for its most recent fiscal year today. Below are the numbers, which are less than stellar. Since June 2011, CalPERS' investment portfolio returned 1% vs a 7.5% target. Returns relative to the portfolio's benchmark for 2012 are below:


Given the size of the portfolio that CalPERS is managing, perhaps it's somewhat excusable that the fund earned a 7.73% return per year over the last 20 years. Still, the fund has returned less than its benchmark (however that's defined) over the 1, 3, 5, 10, 15 and 20 year time period.

Monday, July 16, 2012
WFC 2Q12 Conference Call Highlights
Quotes from 2Q12 WFC Earnings Call
- organic growth in both commercial and consumer portfolios.
- average core deposits up $10.1 billion from the first quarter, up $73.2 billion or 9% from a year ago.
- net interest margin was unchanged at 3.91%
- established an efficiency ratio target of 55% to 59%
- charge-offs were...1.15% of average loans, down...$3.2 billion or 59% [from 4Q09 peak].
- Nonperforming assets were down $1.8 billion from the first quarter, down 11% from a year ago. NPAs were 3.21% of total loans in the second quarter, the lowest level since 2009.
- Our estimated Tier 1 common equity ratio under the latest Basel III...7.78% for the second quarter
- Return on assets was 1.41%, the highest in 16 quarters and within our target range of 1.3% to 1.6% that we provided on Investor Day. Our ROE grew to 12.86%, also within our target range of 12% to 15%
- I think the market continues to provide opportunities for firms that have the liquidity and the capital to [make acquisitions]. Whether or not we'll be successful, I certainly can't promise you because we turn down more than we pursue.
- We're not taking any significant duration risk or any significant credit risk [in the securities portfolio]. This is still a very high-quality portfolio and the duration is relatively short.
- Random quote from Stumpf that typifies WFC culture: But, Mike, we will not stretch for something. If -- I mean, that we -- it's just not in our culture to do that. So if we happen to have something that goes down one quarter, that's life.
Is "Fiscal Cliff" taking mind-share from "BRIC" and "PIIGS"?
Last week I posted a chart comparing "fiscal cliff" on google trends to "green shoots" and "moral hazard." Since then, I thought of two other good terms for comparison: "BRIC" and "PIIGS." Below is a chart comparing these. Somewhat surprisingly, fiscal cliff has overtaken references to PIIGS and BRIC in news reference volume.


Citi 2Q12 Conference Call Summary
Quotes of interest pulled from the C 2Q12 call:
- On a macro level, we believe the euro zone overhang will continue. Our on the ground sense of the emerging markets leaves us more positive than we were a few months ago, and maybe even better than some market perceptions.
- In the U.S. consumer demand and Basel loan demand remain low, as consumers continue to deleverage. And as Federal banks have lowered interest rates, the margin from lending has decreased, and it is expected rates will stay low for the near future.
- Citigroup end-of-period loans grew 1% year-over-year to $655 billion as continued loan growth in Citicorp outpaced the wind-down of Citi Holdings, and deposits grew 6% to $914 billion.
- Total Citicorp loans grew 10%, with consumer up 2% and corporate loans up 22%. Excluding FX, Citicorp loans grew 13% with consumer up 5%.
- SWe ended the quarter with a $191 billion in Citi Holdings were roughly 10% of total Citigroup assets. The $18 billion reduction in the second quarter included roughly a $11 billion of sales approximately $6 billion of net runoff and pay-downs and $1 billion of net credit and net asset marks.
- ...Global Consumer Banking, overall credit quality remains good, with continued improvement in North America and stable credit in Asia and Latin America.
- Latin America, despite the noise this quarter from FX was the fastest growing of our regions in consumer....particularly in Mexico
- Asia consumer revenue growth has slowed...retail investors in Asia have de-risked giving the same global macro concerns...specific country slowdowns, most notably in Korea where policy actions by the government have trimmed the availability of consumer credit in that market...
- ...some revenue headwinds for Asia, into the third and fourth quarters.
- North America consumer benefited from another quarter of strong mortgage activity...however, in cards...[reflect] ongoing economic uncertainty and deleveraging
- ...do not infer from the situation of one LIBOR submitting bank that every bank is in the same or a similar position...
- There are still an awful lot of foreclosed – or foreclosures and profits that had yet to hit the market. So I don’t look at this yet as being a robust housing situation...the early 90s were small potatoes compared to what we’re going through now
Deposit Growth at US Banks
Citigroup reported strong earnings this morning as did JP Morgan and Wells Fargo last week. All three banks also reported strong deposit growth as well. Systemically, despite low interest rates, US banks have been growing deposits at an above average rate. Y/Y, savings deposits grew by 11.5% as of the week of July 2. On average, since 1985, savings deposits have grown by 8.4% Y/Y. The higher than average growth in deposits since '09 suggests that Americans are more comfortable saving via deposits rather than capital markets.


Retail Sales June 2012
Retail sales were reported this morning for June and were weak again. For the third straight month, retail sales declined, which is a reasonably rare occurrence. Since 1992, there have been 4 periods that retail sales have declined in three straight months. Two of those periods happened in 2008; one of those periods lasted for 6 months. Below is a list of negative retail sales streaks:

Looking at the bigger picture, retail sales growth has slowed to just a 3.8% y/y increase in June. The slowing trend doesn't necessarily indicate recession, but certainly demonstrates that the rapid growth phase of the economic cycle is over. As recently as this time last year retail sales were up 9.2% y/y, but now it looks like there isn't the same slack in the economy that there was then to generate large growth numbers.


Looking at the bigger picture, retail sales growth has slowed to just a 3.8% y/y increase in June. The slowing trend doesn't necessarily indicate recession, but certainly demonstrates that the rapid growth phase of the economic cycle is over. As recently as this time last year retail sales were up 9.2% y/y, but now it looks like there isn't the same slack in the economy that there was then to generate large growth numbers.

Friday, July 13, 2012
Cumulative Bond and Equity Fund Flows Since 1996
Reposted here from zerohedge is a stunning chart of cumulative flows to bond and equity funds since 1996. It shows that total fund flows into equity funds are negative over the last 16 years. Considering that US households have saved $5.4T over this time period (according to the BEA), the fact that equity funds have not seen positive inflows is staggering.


Comparing Fund Managers to Golfers and Par
A perennial argument against "active" investment management is that the majority of fund managers don't outperform their benchmarks. Last year, 84% of managers trailed their benchmarks, a pretty damning statistic.
Since I like to do offbeat posts on Friday, I thought it might be interesting to compare that statistic to the number of golfers who shoot par. It turns out that the relative aptitude of golfers and portfolio managers is pretty similar. Only 25% of golfers break 90. Less than 1% are scratch golfers. If par is the benchmark, then most golfers are failing miserably. Of course, this is a snapshot of all adult golfers, not professionals. Professionals are expected to break par. Also, you can't make a decision to "invest" in a par scorecard like you can an index portfolio like SPY.
Still, the very idea of benchmarking performance against an index is one that needs to be considered holistically. After all, there is no such thing as completely passive management. If not at the security selection level, there is an active decision made at the asset allocation level. There are just fewer institutionalized benchmarks to measure the quality of those decisions. There are likely very few investors with the stomach to hold the SPY as the only holding in their portfolio and keep it that way through retirement, so very few people really get the index return anyways. Any deviation from the index would technically be underperformance.
![]()
Since I like to do offbeat posts on Friday, I thought it might be interesting to compare that statistic to the number of golfers who shoot par. It turns out that the relative aptitude of golfers and portfolio managers is pretty similar. Only 25% of golfers break 90. Less than 1% are scratch golfers. If par is the benchmark, then most golfers are failing miserably. Of course, this is a snapshot of all adult golfers, not professionals. Professionals are expected to break par. Also, you can't make a decision to "invest" in a par scorecard like you can an index portfolio like SPY.
Still, the very idea of benchmarking performance against an index is one that needs to be considered holistically. After all, there is no such thing as completely passive management. If not at the security selection level, there is an active decision made at the asset allocation level. There are just fewer institutionalized benchmarks to measure the quality of those decisions. There are likely very few investors with the stomach to hold the SPY as the only holding in their portfolio and keep it that way through retirement, so very few people really get the index return anyways. Any deviation from the index would technically be underperformance.

Thursday, July 12, 2012
Comparison of Japan, US and European Consumer Balance Sheet
When comparing the economies of Japan, Europe and the United States, it's important to remember that the structure of the financial systems of each area are very different. Below is a great chart put together by the BOJ which compares what the asset side of households' balance sheets looks like.
US consumers hold a much larger share of their financial assets in equity markets compared to Japanese or Euro area residents. This is why when the equity markets sell off in the US there is a much greater effect on the real economy than there is in Japan or Europe. In Japan and Europe, the consumer doesn't get the signal of a weak economy until unemployment rises, or the banking system hurts to the point that deposits are impaired.

US consumers hold a much larger share of their financial assets in equity markets compared to Japanese or Euro area residents. This is why when the equity markets sell off in the US there is a much greater effect on the real economy than there is in Japan or Europe. In Japan and Europe, the consumer doesn't get the signal of a weak economy until unemployment rises, or the banking system hurts to the point that deposits are impaired.

Comments From Marriott 2Q12 Call
Fastenal had negative things to say about the industrial/manufacturing outlook, but Marriott is a little more upbeat on its North America business:
Also, not related to any outlook, but I like to file away useful information like this:
I know that first and most important question you may have is, are you seeing a slowdown in North America, and the answer is no. There's plenty of evidence of continuing strength in our lodging business in North America.An interesting response to a fiscal cliff question:
I think that if you're talking about the fiscal cliff of the expiration of the Bush tax cuts, the Obama employment tax cuts and maybe deficit impact, as well as the government cuts...I would say today that there is no impact of that threat on the numbers we've put on the books or the bookings that we're seeing. And we have certainly not made any effort to factor in a what-if. And obviously, we haven't given you '13 guidance anyway. But I think, by and large, this is going to be a question about what happens politically and how that translates into a U.S. economic performance in 2013 and beyond. It may be that it becomes relevant in the fourth quarter, but I doubt it. I think this is much more likely to be a question of how it gets factored into real economic growth, maybe a little bit attitude and sentiment as we're doing bookings in the fourth quarter but doubtful in terms of the impact to actual Q3 and Q4 numbers.
Also, not related to any outlook, but I like to file away useful information like this:
China is probably about 1 million rooms across the country as a whole. The U.S. is 5 million rooms. China will clearly see that 1 million rooms double and then double again over the course of the next period of time. It's going to imply substantial supply growth year-over-year for a number of years to come. But there's every reason to believe that demand is going to be growing with it.
Comments from Fastenal CEO
I thought this comment from the Fastenal conference call was worth highlighting. It's the first thing that the CEO addresses:
Manufacturing has slowed, that's clear. But on a very positive note, I've been out talking to lot of our regional people and district people, and we have not seen a lot of abrupt changes. It's more of a step-down, and we haven't seen a lot of panic from our customers, so we think although it's much slower, so much slower than it was, it doesn't appear to be a lot of panic going on, so that gives us some optimism for the next several months.
Fiscal Cliff Google Trends
Every so often the financial media picks up on a catch phrase on runs with it. Recently, we've been hearing a lot about the "fiscal cliff" that's approaching towards the end of the year. In the past, two other terms that have been in vogue were "green shoots" in 2009 and "moral hazard" in 2008. Below is a google trends chart of these three terms.

Update:


Update:
Added "double dip" to the mix...

Google Trends Recession
Even though the stock market has been less than wonderful over the last few months, the good news is that (as evidenced by google trends) recession chatter isn't as ubiquitous as it has been in previous years. The last time that we entered a recession in 2007 google search volume for "recession" exploded even as we were only debating the subject at the time. So far in 2012, we haven't seen anything nearly as severe. In the summer pullbacks of 2010 and 2011 there were small spikes in recession searches, but we haven't reached those levels in 2012 and the trend in recession searches has generally been falling.


Wednesday, July 11, 2012
Chart of S&P 500 Priced in Oil
To be paired with the previous post--a chart of the S&P 500 priced in terms of barrels of oil. Currently the S&P 500 "sells" for about 16 barrels of WTI crude. This is pretty consistent with the range that existed in the 80s and early 90s before the index level was the equivalent of 100 barrels of crude.


Long Term Chart of S&P 500 Priced in Gold
The great team over at the St. Louis Fed has finally added historical gold prices into the FRED database. This allows us to now create great long term charts like the one below--the S&P 500 priced in gold ounces since 1968. To the extent that one believes that gold is a useful ruler for measuring value, this chart should be an important one. The S&P 500 is cheaper in gold terms than it was in 1968, but still isn't quite as cheap as it got in 1980 when it sold for just 0.17 ounces of gold.


Tuesday, July 10, 2012
July Earnings Calendar
Earnings season is always important, but it's difficult to remember one that has been more anticipated than this one is. Below is a calendar of conference calls by day for the month of July. The full calendar can be found at www.earningscast.com along with links to most conference calls.

Friday, July 6, 2012
July 2012 Investor Letter
Below is a letter that is written monthly for the benefit of Avondale Asset Management's clients. It is reproduced here for informational purposes for the readers of this blog.
Dear Investors,
The S&P 500 was up by almost 4% in June, which was a strong month, but there wasn’t a lot of fundamental change that caused the market to rise by such a large amount. Almost all of the gain happened on the final day of the month when there were of reports of a European compromise on a Spanish bailout. There were hardly any details about the compromise though and details continue to be sparse nearly a week later. For now it looks like this agreement isn’t much different from any other agreement that has already been made by the Europeans. Therefore, it’s logical to assume that this won’t be the last time we hear about a European crisis.
I think anyone who is expecting a grand compromise from Europe is going to continue to be disappointed though. There is only so much that can be done to change the current situation other than to implement proper deficit reducing policies and be patient. In reality the Europeans have already done a lot to try to please the markets in the short term. There have been an endless number of bailouts, agreements and summits that have resulted in a number of tangible actions. The ECB has printed as much money as the Fed has now, and Greece has written the face value of its debt down by half. In true European style though, the governments’ war with Eurobears continues to be a battle of attrition. It’s difficult to see how one side will deal the other a knockout blow and the most likely end will be an armistice founded in fatigue. It’s nearly impossible to forecast when this will occur, but the longer the battle draws out, the more that the cards are stacked in favor of the governments of Europe. It was always a long shot that Eurobears would force a collapse of the EMU, and at some point the markets will simply get tired of the European story and move on to another.
The other newsworthy event in June was that US economic data continued to show some signs of deterioration. Of 14 major US economic indicators released during the month, 13 were below Wall Street’s expectations, including important measurements of unemployment, retail sales, consumer confidence and industrial production. Earlier in the year, some had hoped that the US might be able to decouple from troubles in Europe and China, but recent data has left that thesis on unsettled ground. Still, it is only one month of data, and a particularly noisy one because of the heightened effect of seasonality on economic data in summer months. At this point, an American recession continues to look unlikely to me.
As for our portfolio positioning, we remain opportunistic in our purchases and have now reinvested most of the excess cash that we have been holding since February. At the beginning of June with markets near their lows, I took us to what I would consider a market neutral position and had us leaning slightly bullish into month end. While I was initially expecting July to be a strong month (as seasonality begins to turn more positive in July), June’s late month rally may have served to steal some of July’s return prospects. Earnings season will begin soon, which could increase volatility and hopefully give us some good buying opportunities. Given economic volatility in the second quarter, few are expecting companies to report good numbers.
Scott Krisiloff, CFA
Opinions voiced in the letter should not be viewed as a recommendation of any specific investment. Past performance is not a guarantee or reliable indicator of future results. Investing is subject to risk including loss of principal. Investors should consider the suitability of any investment strategy within the context of their personal portfolio. For more information on Avondale Asset Management, readers may be directed here.
Tuesday, July 3, 2012
Happy Birthday America!
Tomorrow, the USA will be celebrating its 236th birthday. To celebrate the occasion, below is a chart of Federal Government Debt to GDP since our government was just a babe. The only period that the Federal Government has been debt free began in 1835 when Andrew Jackson paid off all borrowings.


Monday, July 2, 2012
What Does a Poor ISM Mean For Stocks?
ISM dropped below 50 for the first time in 2 years, which is certainly not a positive indication for US economic activity, but what does it mean for stock market returns? Since securities markets are supposed to be forward looking (with varied levels of success) many times they will have discounted dire scenarios before the data confirms a slowdown. With negative scenarios already discounted, sometimes high readings can be a negative indicator while low readings can actually be a positive for future returns. Below is a chart of the 12 month forward returns of the S&P 500 when ISM goes from an above-50 reading to a sub-50 reading. In 31 tries since the 1950s, the S&P 500 has been positive nearly 2/3 of the time 12 months after the first cross over. On average, the forward return is 9.14%. Still, it should be noted that the last 4 times in a row that ISM has crossed below 50, forward returns have been negative. In 2008, they were extremely negative, -44%.


Subscribe to:
Posts (Atom)