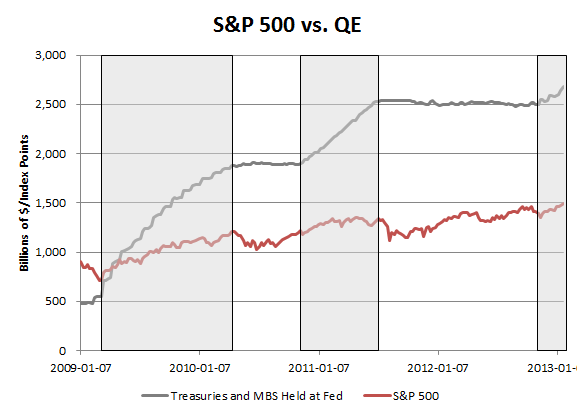
Below is a chart of how the S&P 500 has done during periods of QE, but instead of using the announcement dates, the chart highlights the times that the Fed's holdings of Treasuries and MBS were increasing (note that this analysis therefore excludes operation twist). Since the S&P 500 is now hitting new cycle highs, perhaps one could argue that QE hasn't exactly lost its potency.
Tuesday, January 29, 2013
QE Effect on S&P 500
After QE3's announcement in mid September there was some concern that the effect of QE on the market had eroded because the S&P 500 proceeded to sell off by 5%. It could be true that QE is losing its efficacy, but it's worth noting that true balance sheet expansion didn't really start until mid November because of the mechanics of MBS purchases. It therefore may or may not be coincidental that MBS started to show up on the Fed's balance sheet around the same time that the S&P 500 found a bottom.
Subscribe to:
Post Comments (Atom)


No comments:
Post a Comment
For compliance reasons, I don't post comments to the site, but I do like hearing from readers and am happy to answer any questions. Feel free to use the comment box to get in touch. Please leave an email address in your comment so that I can write back, or email me directly at Skrisiloff@avondaleam.com.