
Friday, May 25, 2012
Deja Vu All Over Again
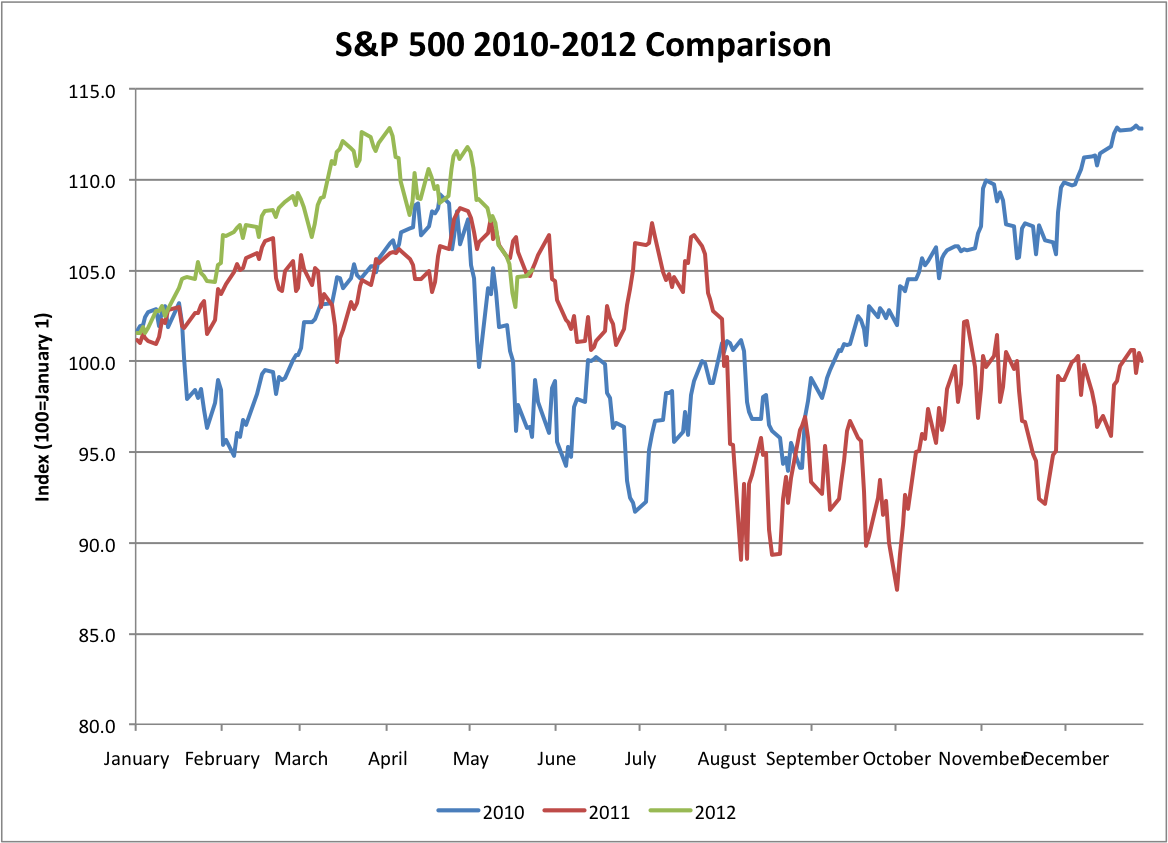
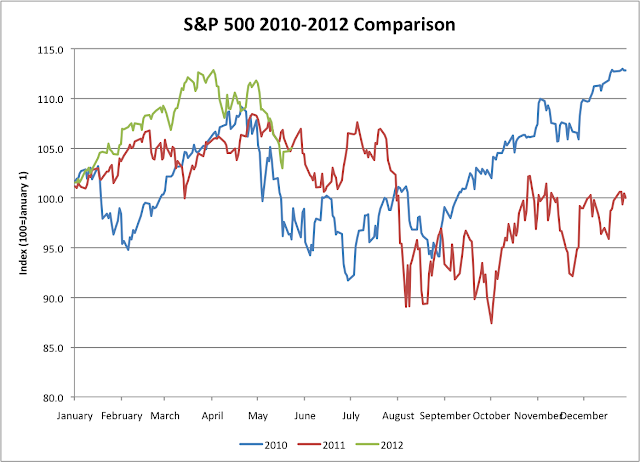
A little under halfway through the year, many are talking about the fact that 2012 is starting to look a lot like 2011 and 2010. For a look at just how closely we're tracking the last two years, below are the annual charts of 2010-2012 plotted on the same chart. The graph is indexed so that January 1=100 for better comparability.
Subscribe to:
Post Comments (Atom)
No comments:
Post a Comment
For compliance reasons, I don't post comments to the site, but I do like hearing from readers and am happy to answer any questions. Feel free to use the comment box to get in touch. Please leave an email address in your comment so that I can write back, or email me directly at Skrisiloff@avondaleam.com.